
An adult Columbia sheep at the Imperial Ranch in Maupin, Ore. OLIVER JEVREMOV
When Maxine Bedat and Soraya Darabi set out to make a wool sweater entirely in the U.S., their first challenge was finding sheep. Read more
An adult Columbia sheep at the Imperial Ranch in Maupin, Ore. OLIVER JEVREMOV
When Maxine Bedat and Soraya Darabi set out to make a wool sweater entirely in the U.S., their first challenge was finding sheep. Read more
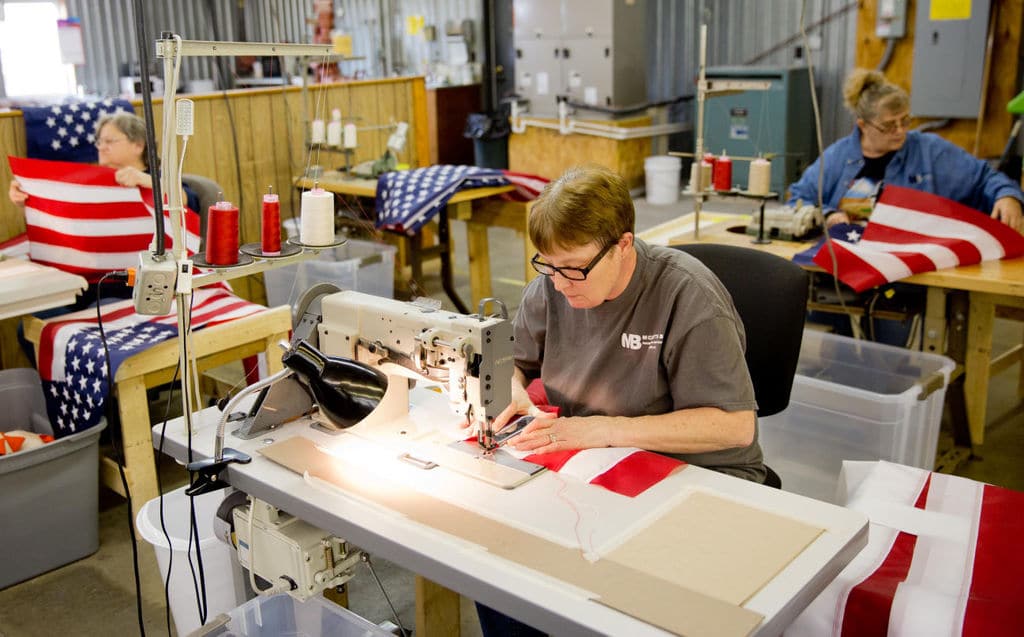
SARAH HOFFMAN/THE WORLD-HERALD
From left, Melissa Kleitsch, Diane Hynek and Laurie Bessler sew American flags at MSA Brand Products in the McBattas Packaging and Printing building in Fairbury, Nebraska. The former Swingster sewing factory — where Bessler worked for 17 years — has been transformed to produce and sell American flags made in the U.S.
The American flag flapping above the McBattas Packaging and Printing building on the north edge of town is unremarkable as flags go.
At 3-by-5-feet, it’s not especially large. Its colors, of course, are the standard red, white and blue, and it has 50 stars and 13 stripes. Read more
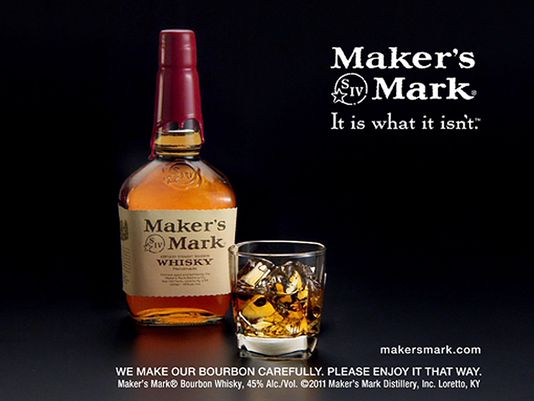
(AP Photo/Marker’s Mark Distillery Inc., File) ORG XMIT: NY119
Two California consumers sued one of Kentucky’s best-known distilleries, saying Maker’s Mark tries to spike demand and sticker prices by falsely promoting and advertising its bourbon as being handmade.

It’s time for America’s annual holiday study of contrasts.
First comes Thanksgiving, a heritage slightly scarred by glitzy parades, football, turkey fryer incidents, and overeating, but still imbued with volunteerism, thankfulness, and family.
Then comes Black Friday. Read more

Photo Credit: Kat Mulkey via Flickr
by Alliance for American Manufacturing
Get to the stores before it’s all gobbled up. Read more
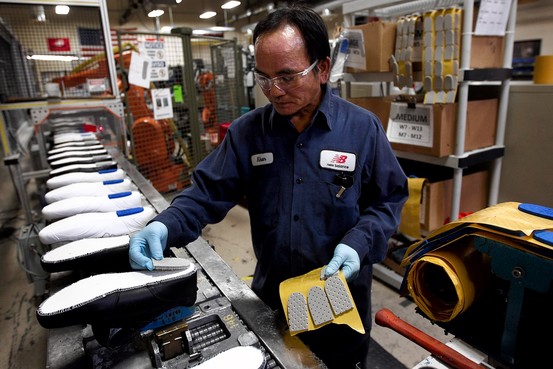
The assembly line at a New Balance factory in Boston in 2012. Associated Press
New Balance—the iconic U.S. sneaker maker—has long marched to its own drummer on “Made in USA” labels. Read more

The U.S. News/Raytheon STEM Index shows that STEM employment in the United States has gone up by more than 30 percent, from 12.8 million STEM jobs (as defined by the U.S. government) in 2000 to 16.8 million in 2013, and a February report by Burning Glass Technologies indicated the STEM job market is actually far larger than that. Kelly also points out that the analytical reasoning and problem-solving skills associated with science, technology, engineering and mathematics are increasingly important for jobs that aren’t traditionally defined as being in STEM fields.
“People are measuring the number of Ph. D. engineers and scientists out there, but the mechanics putting the wings on the airplanes need STEM skill sets, too,” he says. “This is not simply an issue about guys with lab coats and pocket protectors. This is way beyond that.”
Launched with support from the Raytheon Company, the new U.S. News/Raytheon STEM Index measures annual changes in key indicators of STEM activity in the United States relative to the year 2000; it is not a comprehensive measure of all STEM economic or STEM education activity in the United States and does not determine whether explicit STEM goals are being met. The Index is made up of 93 sub-indices and thousands of data points divided into eight components: ACT math and science scores, Advance Placement (AP) test scores in STEM subjects, college and graduate degrees granted, U.S. employment in STEM fields, Program for International Student Assessments (PISA) math and science scores, SAT math scores, National Assessment of Educational Progress (NAEP) math scores and interest in STEM at the high school level. It relies on data from the U.S. Bureau of Labor Statistics, the National Center for Education Statistics, the College Board, the National Research Center for Colleges & University Admissions, the ACT and the Organization for Economic Co-operation and Development.
As with other widely followed indices like the S&P 500 or the Consumer Price Index, the weights and components for future U.S News/Raytheon STEM Indices will likely change as more numerous and refined indicators become available. “For instance, we know that the way the federal government classifies STEM jobs undercounts them, possibly by a lot,” Kelly explains.
“Science, technology, engineering and math form the foundation of the global economy,” says Raytheon Chairman William Swanson. “Yet, as the STEM Index suggests, if educational trends continue, fewer qualified candidates will be available to support growth in these areas. It’s critical to our business and the United States’ long term economic outlook that we inspire young people to engage in STEM and dedicate resources to supporting them throughout their academic lives.”
Even with the most weight given to the broadest indicators — STEM employment and STEM degrees granted — the Index shows there has been only modest gains in overall STEM activity since 2000.
The component index for AP tests offers one such example. “In 2000, around 423,000 STEM AP tests were taken,” Morse explains. “In 2013, that number ballooned to 1.2 million. This shows us that despite our graph looking like AP STEM is in a major downslide, in reality there has been real growth in numbers. This is an indication of the rapidly growing popularity of all AP tests in general and that the growth in STEM AP tests is not keeping pace.”
Still, the relatively flat overall Index calls into question the effectiveness of multiple plans to increase STEM awareness and activity in the U.S., including President Barack Obama’s 2009 Educate to Innovate initiative. While the actual number of STEM degrees granted, employment in STEM fields, and the number of STEM-related AP tests have gone up since 2009, other indicators — like SAT and NAEP scores — have stagnated, and other key areas have declined.
“There’s not much evidence so far that government actions have had a significant effect,” Kelly says, stressing that some initiatives, like the Common Core State Standards, which were created in part to address the national STEM education crisis, have not been yet fully implemented.
According to the U.S. News/Raytheon STEM Index, high school student interest in STEM fields reached a low point in 2004, dropping nearly 19 percent from the base-year calculations. Interest levels climbed steadily until 2009, when they began to decline again. In spite of the intense drive to encourage students to study science, interest levels fell between 2009 and 2013 and are now just slightly below where they were in 2000.
The lack of progress among female and minority students is especially troubling in the long term.
“A big part of the problem is the continuing split that puts Asian-Americans and white males on the side of those who are driven to acquire STEM skills, and women, blacks and Latinos on the other side of the dividing line” says Kelly. “T
he labor pool going forward will not be made up mainly of white males and Asian-Americans. The labor pool will be increasingly Latino, and that group is not advancing in STEM fields right now.”
As high school students’ interest in STEM has waned, their scores on international assessments like PISA have dropped, the U.S. News/Raytheon STEM Index shows. According to the latest PISA data, released in December, students in other countries continue to outperform those from the United States in math and science.
“The big picture of U.S. performance on the 2012 PISA is straightforward and stark. It is the picture of educational stagnation,” Secretary of Education Arne Duncan said at the time. “In a knowledge-based, global economy, where education is more important than ever before, both to individual success and collective prosperity, our students are basically losing ground.”
But Kelly cautions that the issue is more complicated than just “us vs. them.” While international assessments like PISA show the U.S. is falling behind, other data used in the U.S. News/Raytheon STEM Index, like NAEP scores, show an improvement over time.
“Even with gains domestically, we can still be losing ground against our international competitors,” Kelly explains.
“There are many very good initiatives and lots of work being done to address the problem,” he continues. “But as the data show, it’s still not enough. There is a mismatch of skills and jobs, of supply and demand, and the challenge is to get them aligned again.”

In an update of its investigation last week, the FDA said it found that antiviral drug amantadine in some samples of imported chicken jerky treats sold a year or more ago, but doesn’t think it caused the illnesses. The FDA said it will continue to investigate.
Rival Petco announced on Tuesday that it would remove all Chinese-made treats from its 1,300 stores by the end of this year after shoppers pushed them to do so. The San Diego company said it has been cutting the number of those treats it sells over the past three years.
PetSmart Inc., which is based in Phoenix, owns more than 1,300 stores in North America.

“Always be aware of what you’re buying and where it’s coming from,” Levine said.
Yet that may not always be enough to keep pets safe; products stamped “Made in the USA” could still contain ingredients sourced from China or other countries, the FDA warned.
The FDA has partnered with the Centers for Disease Control and Prevention (CDC) to figure out what foods may be contributing to pet disease. The study will compare the foods eaten by sick dogs to those eaten by dogs who haven’t gotten sick, in order to determine if the jerky is really the culprit.
So far, testing of jerky pet treats from China revealed low levels of antibiotics as well as the antiviral drug amantadine in some chicken samples. Although FDA-approved for pain-control applications in humans and in dogs, the agency prohibited its use in poultry in 2006 to help preserve its effectiveness.
The FDA does not believe amantadine contributed to the illnesses, as the side effects of the drug do not correlate with the symptoms seen in the pets; however, amantadine should not be present at all in jerky treats.
Chinese authorities have agreed to conduct additional screenings and follow up with jerky treat manufacturers, and the FDA has notified U.S. treat makers of the presence of amantadine in some jerky products. The agency will also continue testing these products for drugs and other antivirals.
The FDA cautioned pet owners that jerky pet treats are not required for a balanced diet. If your pet experiences any sign of illness, including vomiting, diarrhea and lethargy, contact your veterinarian right away.

While labor and energy costs aren’t the only factors that influence corporate decisions on where to locate manufacturing, these striking changes represent a significant shift in the economics of global manufacturing.
China displaced the United States as the largest manufacturing country in 2010, as the United States’ share of global manufacturing activity declined from 30% in 2002 to 17.4% in 2012.