Gallup Poll: Americans Want American Made Goods
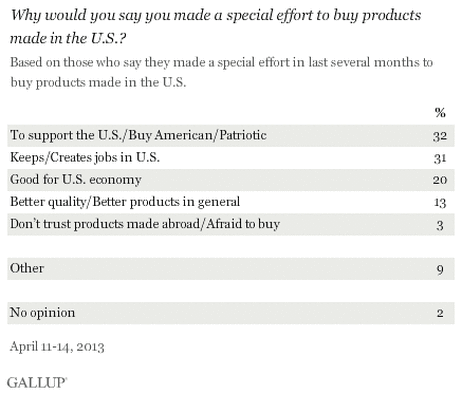
Fewer Americans in the April 11-14 poll mentioned specific attributes of U.S. versus foreign products as reasons for buying American, including the perception that U.S. products are better quality (13%) or concerns about the safety or quality of products made overseas (3%).
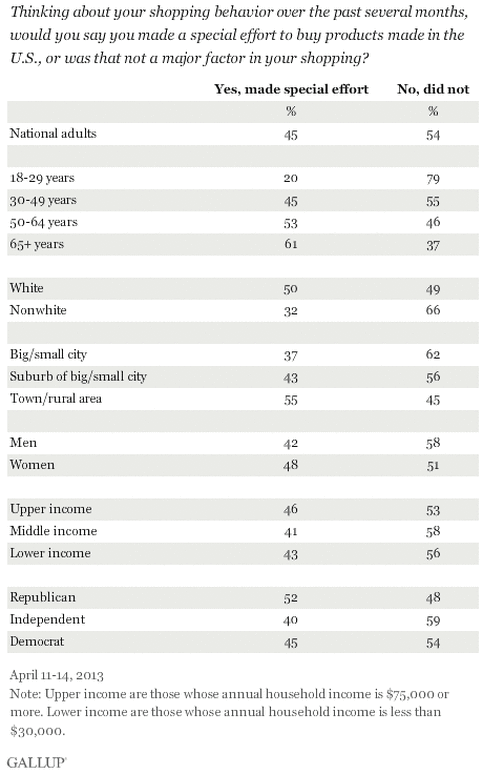
Though a substantial percentage of Americans, 45%, say they have made a special effort to buy U.S.-made products in recent months, more, 54%, have not made an attempt to do so.
There are wide generational differences in U.S.-centric shopping habits, with older Americans (61%), aged 65 and older, much more likely than younger Americans (20%), aged 18 to 29, to actively search for products made in the U.S. Younger Americans may be more accustomed to getting their products from overseas, and with international free trade agreements increasingly common, they may not have been exposed to as much pressure to “buy American.”
In addition to differences by age, there are differences by race and place of residence, with whites and those living in rural areas showing a greater propensity to favor American-made products. There are at best modest differences by gender, income, and party identification.
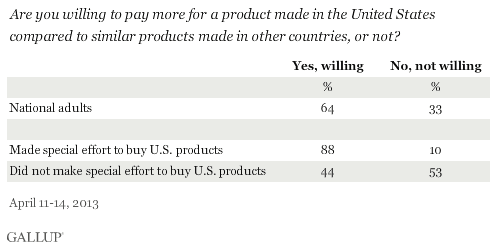
Sixty-four percent of Americans say they would be willing to pay more to buy a U.S.-made product than a similar product made in other countries. This includes the vast majority, 88%, of those who make a special effort to buy U.S.-made products, but also nearly half of those, 44%, who do not.
The question did not specify how much more consumers would have to pay for U.S.-made products than for foreign-made products, but Americans may be less willing to pay significantly more for products made in the U.S. Thus, the 64% willing to pay more for American-made products may be an upper boundary estimate.
Nearly half of young adults, 43%, say they are willing to pay more for U.S. products. However, that figure is much smaller than the 70% of Americans aged 30 and older who are willing to do the same.
Americans Believe U.S. Quality Improving, but Attitudes Unchanged Since 1990
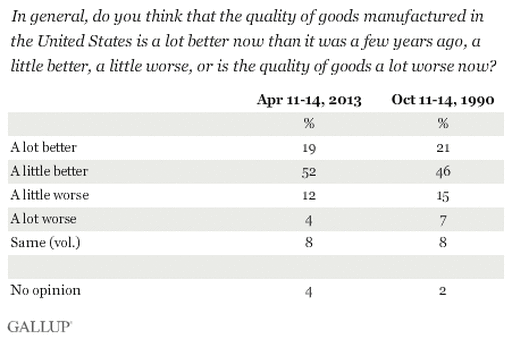
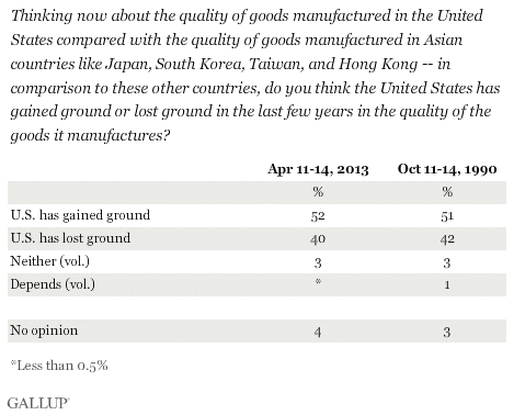
Most Americans believe that U.S. products are better now than they were a few years ago — 71% say they are a lot or a little better, while 16% say they are a lot or a little worse. However, those views are no more prevalent than they were more than 20 years ago, the last time Gallup asked the question in 1990.
Implications
“Buy American” behavior is far from universal in the U.S., but nearly half of Americans say they actively try to buy U.S. products, and even more say they are willing to pay more for U.S. products.
Patriotism and concern for the health of the U.S. economy are major reasons behind people’s shopping for American-made products, but those attributes may be in shorter supply among younger Americans who find less appeal in U.S.-made goods. In fact, Gallup has found younger people in the U.S. ranking among the least patriotic subgroups of Americans.
If younger consumers continue to be less interested in buying U.S.-made products as they get older and future generations show a similar weak commitment to buying American, the wide generational divide in U.S. product shopping behavior could be a concern for the future market of U.S. products.
At the same time, there does seem to be a sizeable latent market for U.S. products that could be tapped, exemplified by the roughly one in five Americans who are not actively shopping for American-made goods but who say they are willing to pay more for U.S. products.
Results for this Gallup poll are based on telephone interviews conducted April 11-14, 2013, with a random sample of 1,012 adults, aged 18 and older, living in all 50 U.S. states and the District of Columbia.
For results based on the total sample of national adults, one can say with 95% confidence that the margin of sampling error is ±4 percentage points.
Interviews are conducted with respondents on landline telephones and cellular phones, with interviews conducted in Spanish for respondents who are primarily Spanish-speaking. Each sample of national adults includes a minimum quota of 50% cellphone respondents and 50% landline respondents, with additional minimum quotas by region. Landline telephone numbers are chosen at random among listed telephone numbers. Cellphone numbers are selected using random digit dial methods. Landline respondents are chosen at random within each household on the basis of which member had the most recent birthday.
Samples are weighted to correct for unequal selection probability, nonresponse, and double coverage of landline and cell users in the two sampling frames. They are also weighted to ma
tch the national demographics of gender, age, race, Hispanic ethnicity, education, region, population density, and phone status (cellphone only/landline only/both, cellphone mostly, and having an unlisted landline number). Demographic weighting targets are based on the March 2012 Current Population Survey figures for the aged 18 and older U.S. population. Phone status targets are based on the July-December 2011 National Health Interview Survey. Population density targets are based on the 2010 census. All reported margins of sampling error include the computed design effects for weighting.
In addition to sampling error, question wording and practical difficulties in conducting surveys can introduce error or bias into the findings of public opinion polls.
View methodology, full question results, and trend data.
For more details on Gallup’s polling methodology, visit www.gallup.com.



Benefits of outsourcing way overrated for americans.
Americans paying as much or more for manufacturing by outsourcing; no noticeable benefit, but plenty of lost jobs, and shoddy merchandise. Knock offs a good example of inability to buy or afford authentic goods.